Work with metrics over time
Once generated via the ValidMind Library, view and add metrics over time to your ongoing monitoring plans in the ValidMind Platform.
Metrics over time refers to the continued monitoring of a model’s performance once it is deployed. Tracking how a model performs as new data is introduced or conditions change ensures that it remains accurate and reliable in real-world environments where data distributions or market conditions shift.
- Model performance is determined by continuously measuring metrics and comparing them over time to detect degradation, bias, or shifts in the model’s output.
- Performance data is collected and tracked over time, often using a rolling window approach or real-time monitoring tools with the same metrics used in testing, but observed across different periods.
- Continuous tracking helps to identify if and when a model needs to be recalibrated, retrained, or even replaced due to performance deterioration or changing conditions.
Prerequisites
Add metrics over time
In the left sidebar, click Inventory.
Select a model or find your model by applying a filter or searching for it.4
In the left sidebar that appears for your model, click Documentation or Ongoing Monitoring under Documents.5
Click on a section header to expand that section and add content.
Hover your mouse over the space where you want your new block to go until a horizontal line with a sign appears that indicates you can insert a new block:

Adding a content block in the UI Click and then select Metric Over Time6 under from library.
By default, only the Developer role can add metrics over time within model documentation or ongoing monitoring plans.
Select metric over time results:
- Choose from available VM Library (out-of-the-box) or Custom tests under metric over time in the left sidebar of the test selection modal.
- Use Search by name on the top-left to locate specific metric results.
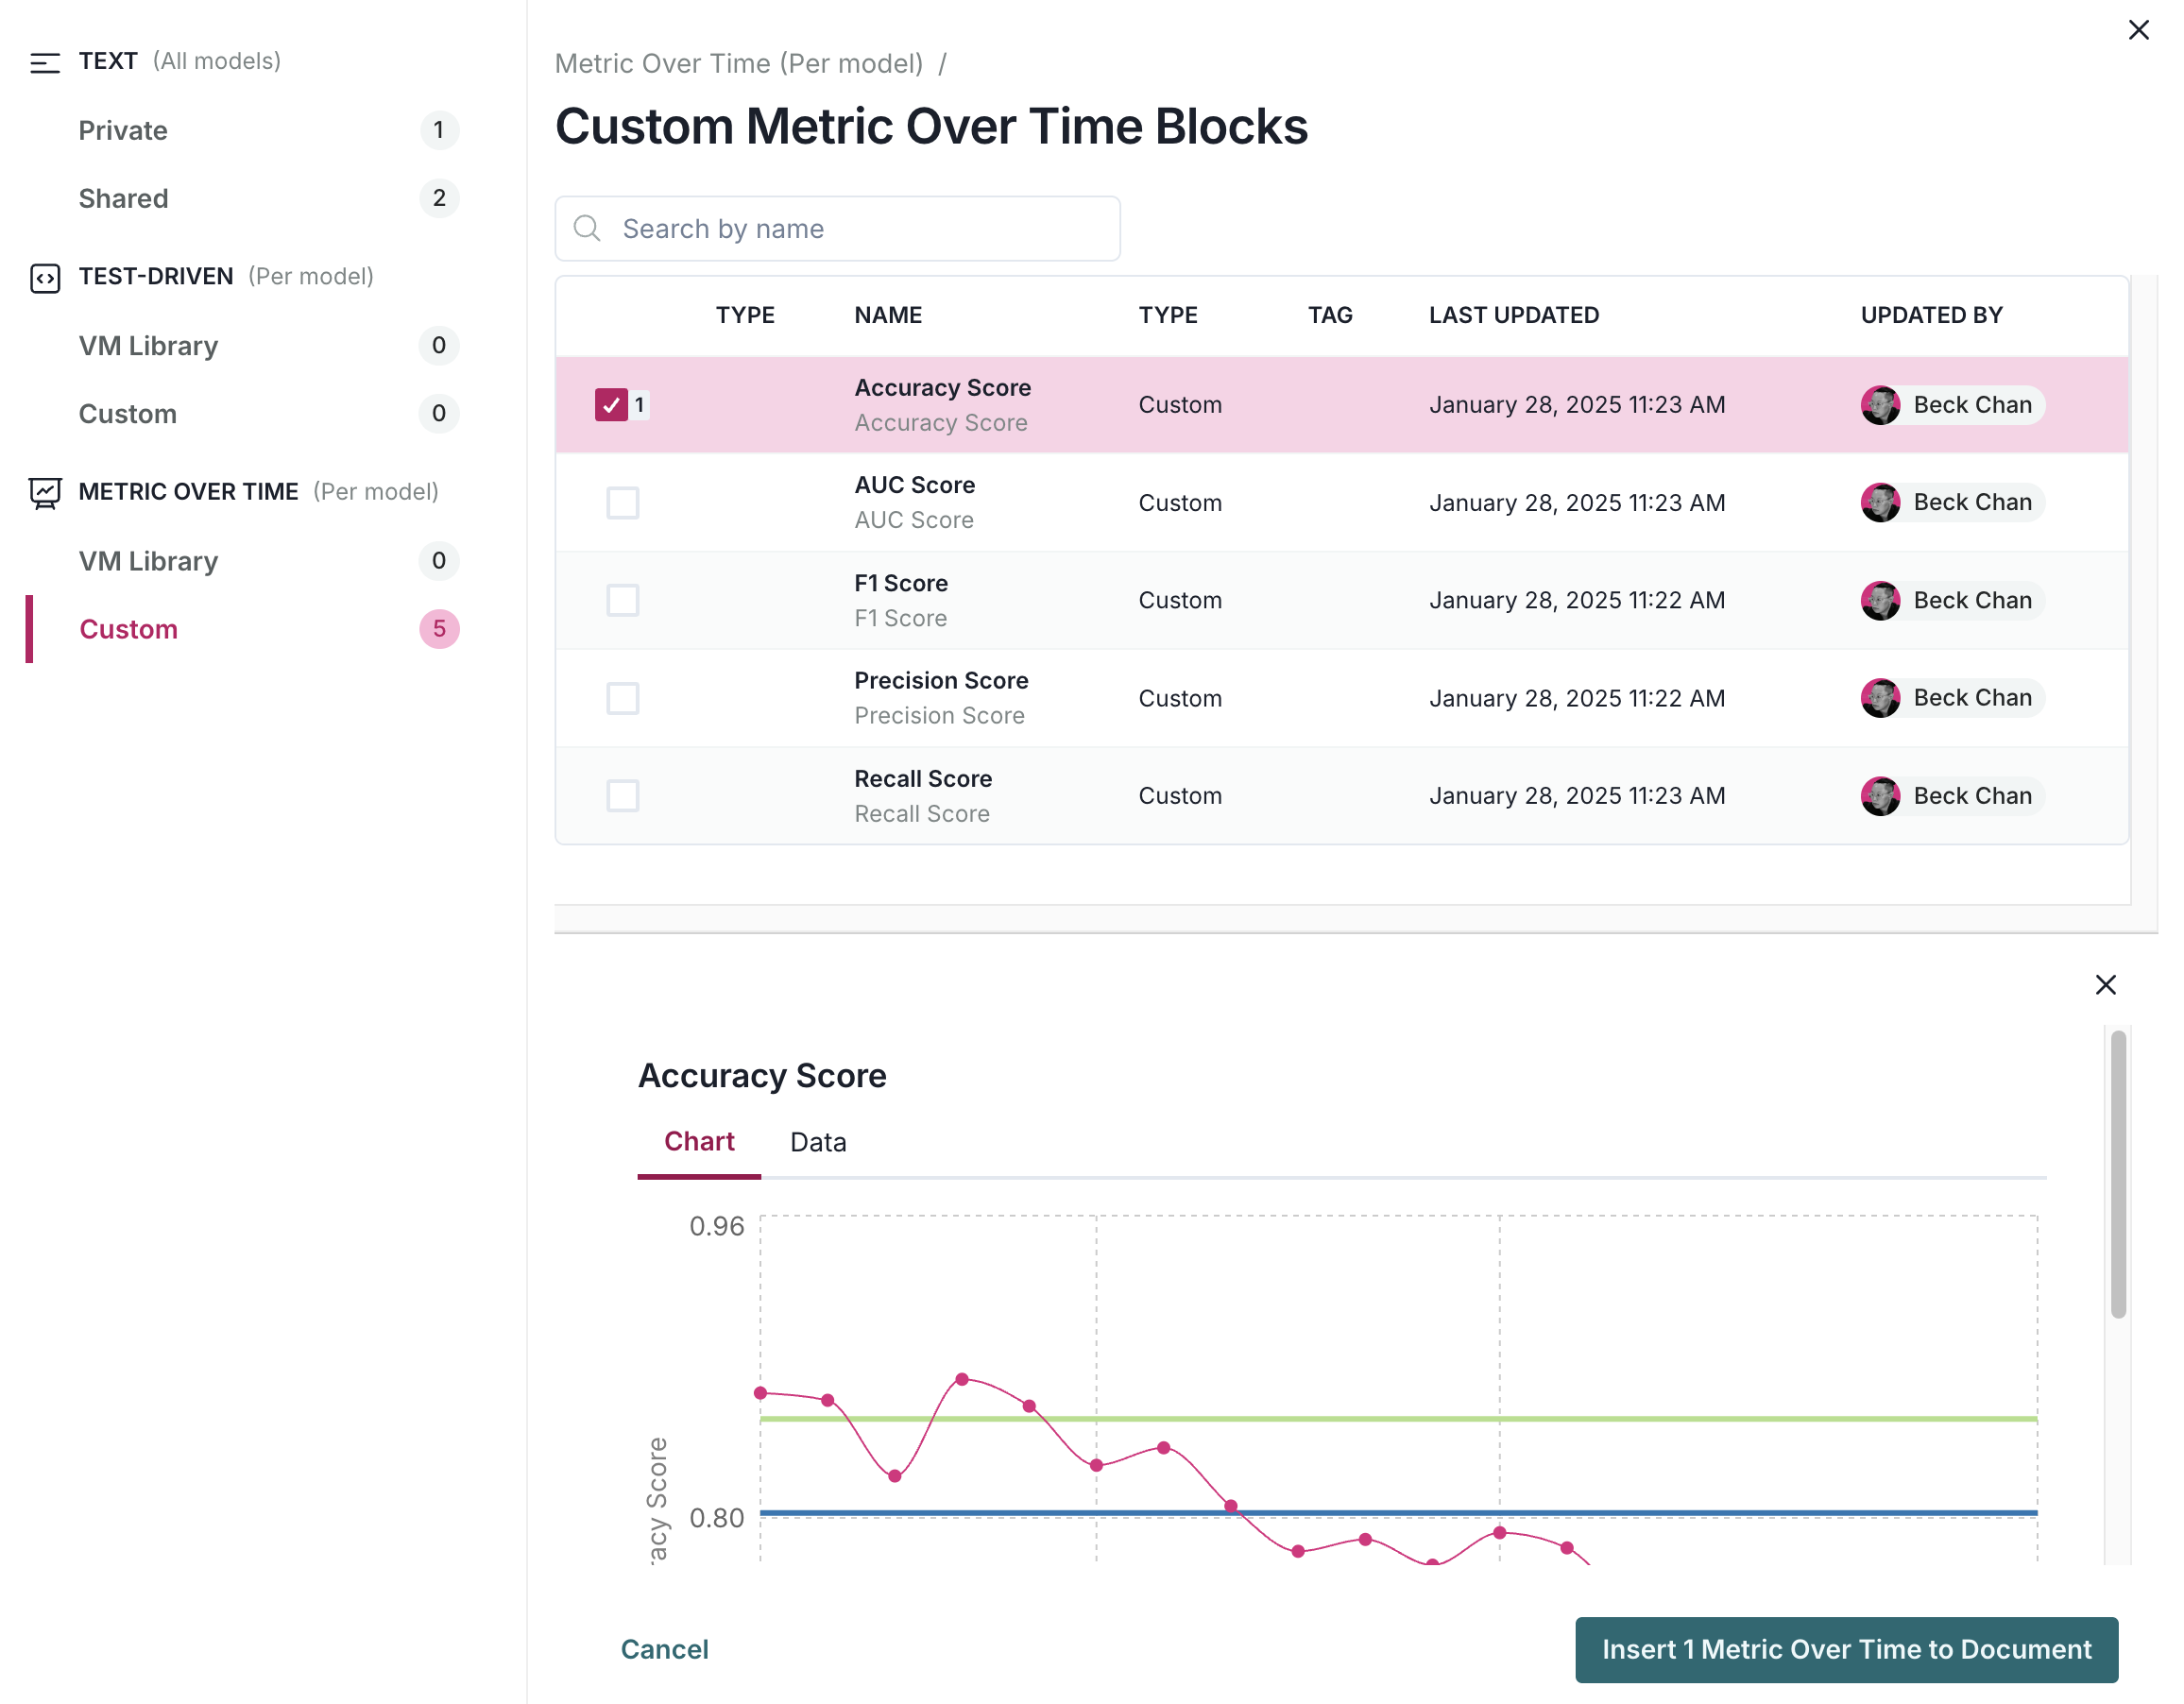
Metric Over Time blocks that have been selected for insertion To preview what is included in a metric, click on it. By default, the actively selected metric is previewed.
Click Insert # Metric(s) Over Time to Document when you are ready.
After inserting the metrics into your document, review the data to confirm that it is accurate and relevant.
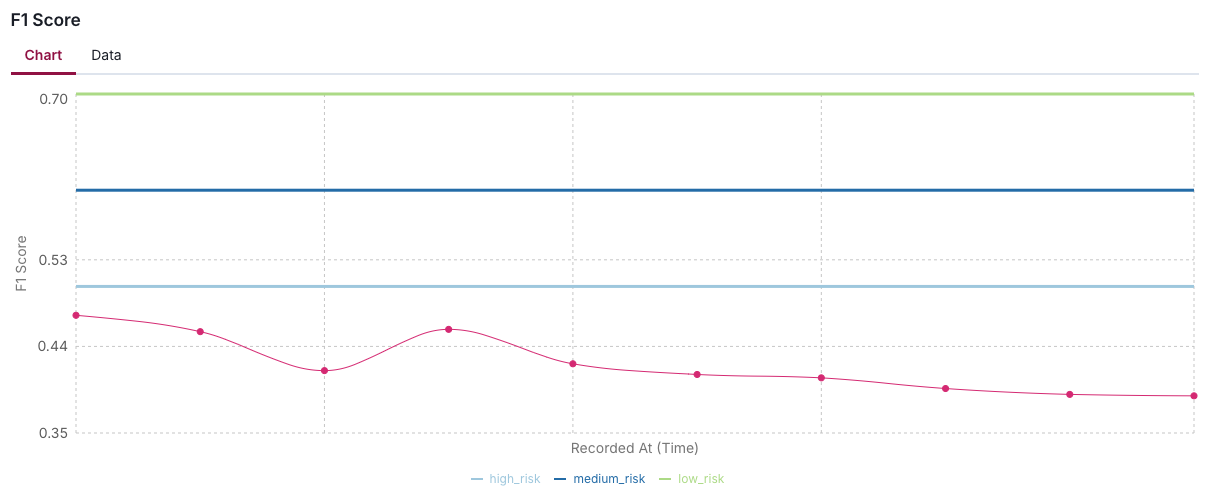
Example F1 Score — Metric Over Time visualization
View metric over time metadata
After you have added metrics over time to your document, you can view the following information attached to the result:
- Date and time the metric was recorded
- Who updated the metric
- The numeric value of the metric
- The metric’s thresholds
- Any additional parameters
In the left sidebar, click Inventory.
Select a model or find your model by applying a filter or searching for it.7
In the left sidebar that appears for your model, click Documentation or Ongoing Monitoring under Documents.8
Locate the metric whose metadata you want to view.
Under the metric’s name, click on Data tab.
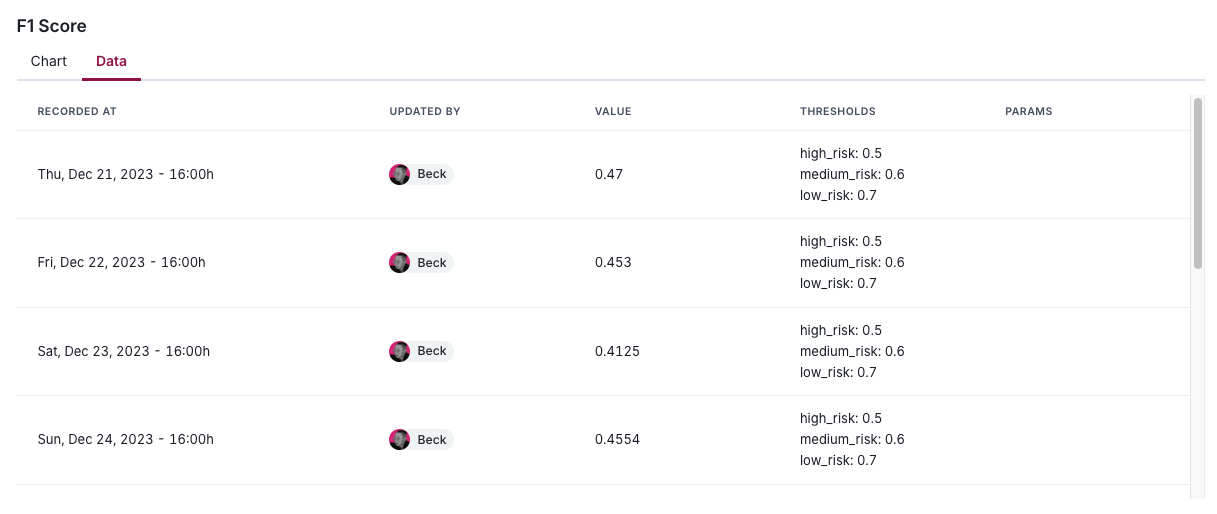
Example Data tab within a Metric Over Time